


IPTV Reseller Analytics comes down to four numbers you can work out from data your panel already stores: how many lines are genuinely active, how many customers renew, how many quietly disappear, and how quickly your credits burn against the money coming in. Everything else is decoration.
Most IPTV Panel resellers never calculate any of them. They log in, glance at the credit balance, see a healthy number of user lines listed, and assume the business is fine. It usually is not fine or unfine in any measurable sense, because a line count is a stock figure and reselling is a flow business. Customers arrive, expire, renew or vanish every single week, and the balance on your dashboard hides all of that movement behind one reassuring total.
Why Your Credit Balance Is the Least Useful Number on the Dashboard
Your credit balance answers one question: can you activate the next customer without topping up. That is worth knowing, but it tells you nothing about whether the business underneath it is growing, flat or slowly leaking.
Two resellers can hold the same balance and be in completely different positions. One spent credits creating forty-eight new twelve-month lines for customers who found them through referrals. The other spent the same credits extending forty-eight expiring lines at a discount, having lost a dozen others that month. Same outflow, same remaining balance, two very different businesses. The dashboard cannot tell them apart, and neither can you until you separate new activations from renewals.
The raw material for that separation already exists. A credit log records every transaction with a timestamp, the line it was applied to and the amount deducted. A user list records creation dates, expiry dates, connection status and device details. That is event data, not analytics. The step nobody takes is pulling it out once a month and turning it into three or four figures that actually describe performance. If you are still learning what your panel records and where, the walk through of how a reseller panel handles credits, user lines and dashboard controls is the sensible starting point before you try to measure anything.
Where IPTV Reseller Analytics Starts: Three Retention Numbers You Can Work Out by Hand
None of these need software. A spreadsheet with a row per customer and a column per month will outperform most reporting tools, because you control the definitions.
Active lines, counted honestly
Your IPTV reseller panel lists every line you have ever created unless you delete them. That total is not your customer base. A line only counts as active if it has an unexpired subscription date and has actually connected recently.
Both conditions matter. Lines that are paid but never connected are usually setup failures, and they are the customers most likely to request a refund or walk away at renewal. Lines that connect but expired last week are not customers, they are a pending decision. Counting them together gives you a number that flatters you at exactly the moment you most need honesty.
Pull the list, filter to unexpired, then check last connection activity. The figure that survives both filters is your real active base, and it is the denominator for everything that follows.
Pro tip: Run a separate weekly filter for lines created in the last seven days that show no connection at all. Chasing those customers on day three costs one message. Chasing them after they have given up costs the renewal.
Renewal rate, measured against the right group
The common mistake is dividing renewals by total customers. That produces a number that drifts with the size of your base and means nothing month to month.
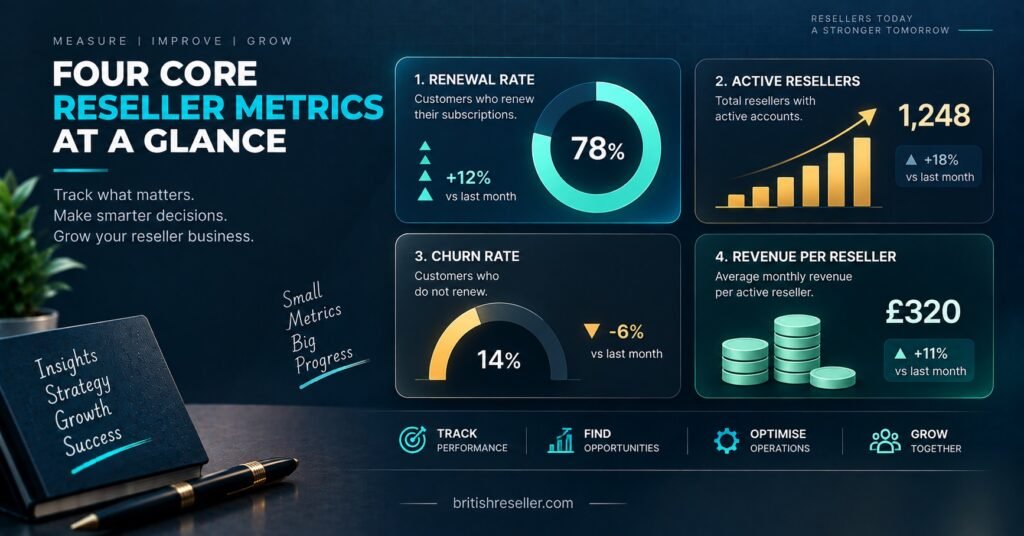
Renewal rate belongs to a cohort: the lines that actually reached their expiry date during the period. If thirty lines came up for renewal in a month and twenty-two were extended, your renewal rate for that month is roughly seventy-three per cent. The other eight are the only customers you need to think about. A twelve-month customer who is not due until next spring has no bearing on this month’s performance, and including them just dilutes the signal.
Track it as a running series rather than a single figure. One weak month tells you very little. Four consecutive declining months tells you something is wrong upstream, usually in service stability, delivery quality or the speed of your own support responses.
Churn, and the moment it actually happens
Churn is the inverse of renewal, but where it clusters is far more useful than the total. Sort your non-renewals by how long the customer stayed.
In most subscription operations the first renewal is the hardest one to win, because the customer is still deciding whether the service fits their household, their devices and their habits. Losses concentrated at first renewal point at onboarding, setup support or an expectation gap created during the sale. Losses spread evenly across long-tenure customers point at something else entirely, usually a change in service quality or a competitor undercutting you.
Same headline number, opposite fixes. That distinction is the entire reason to segment churn by tenure rather than reporting one percentage.
Credit Consumption Is Where the Business Model Shows Itself
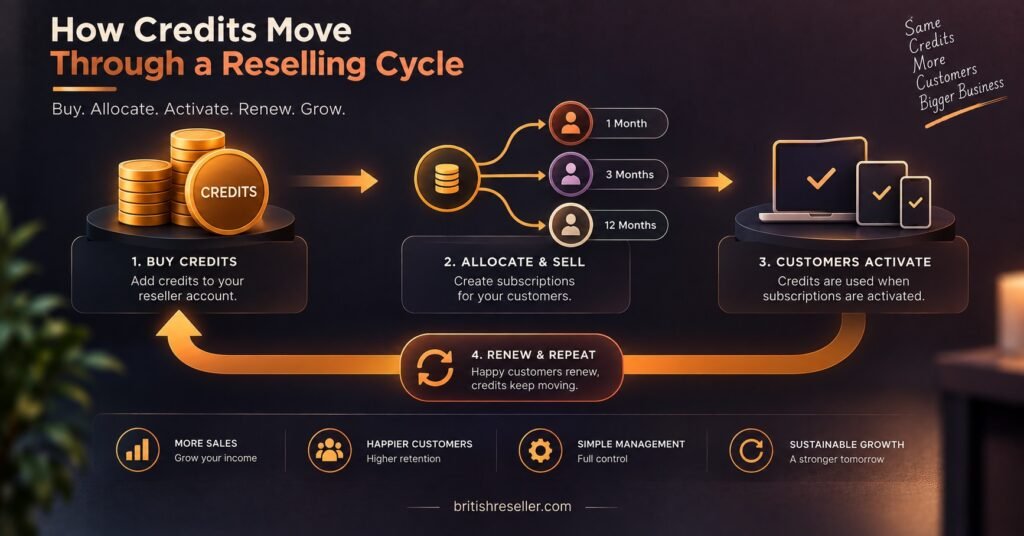
Retention tells you whether customers stay. Credit consumption tells you whether keeping them is worth it.
Three derived figures do most of the work here. The first is credits spent per month, split between new activations and renewals. The second is average credits per paying customer, which exposes discounting and quiet generosity: free extensions given to smooth over a complaint, duplicate lines created during a troubleshooting session and never removed, longer subscription lengths sold at short-term prices. The third is revenue per credit, which is simply your income for the period divided by credits consumed in the same period.
That last one is the number that should move slowly. When revenue per credit starts falling while your active base holds steady, you are working harder for the same money. The usual causes are unglamorous: price competition you have been matching without deciding to, or a growing habit of writing off credits to resolve support issues rather than fixing the underlying cause.
Credit consumption also drives your purchasing rhythm. Once you know your typical monthly burn and the proportion that goes to renewals, you can top up on a schedule instead of scrambling mid-week. Buying in larger blocks usually improves your per credit cost, and comparing that against your own consumption rate is a more useful exercise than comparing credit package pricing and top-up tiers in isolation.
Pro tip: Record the date and size of every top-up in the same sheet as your monthly burn. Two or three months of that gives you a reorder point, and a reorder point removes the most common reason resellers delay a customer activation.
Reading the Numbers When Something Looks Off
Analytics earns its keep when a figure moves and you need to work out why without guessing. The patterns below cover the majority of what a reseller will actually encounter.
| Pattern in the numbers | Likely cause | What to check first |
|---|---|---|
| Active lines flat while credit spend rises | New customers are replacing leavers, not adding to them | New activations against expiries for the same month |
| Renewal rate drops for one expiry window only | A disruption, a delivery failure or missed reminders in that specific period | Support tickets and connection logs for those exact dates |
| Lines paid for but never connected | Credential delivery or first-time setup failure | Whether a first connection was ever recorded, and on which app or device |
| Average credits per customer creeping up | Unplanned discounts, free extensions, duplicate test lines | Credit log entries not matched to a payment |
| Sub-reseller volume strong, sub-reseller renewals weak | Downstream selling on price with thin support behind it | Their renewal cohort calculated separately from your own |
The fourth row catches more IPTV panel resellers than any other. Duplicate lines created while diagnosing a customer issue feel free at the time because the credit cost is small and the problem is urgent. Across a busy quarter they add up, and they never appear as a decision because nobody ever decided to spend that money.
A cluster in the third row is worth treating as a support problem rather than a technical one. Non-connecting lines are rarely a panel fault; they are usually a customer who entered credentials incorrectly, picked an unsuitable player, or gave up before asking. A short, fixed reply covering the two or three most common causes resolves most of them, and the reference material on common playlist and connection failures is a reasonable base to build that reply from.
A Monthly Review That Takes About Twenty Minutes
Reporting fails when it becomes a project. Keep it to a fixed sequence on a fixed day, ideally the first working day of the month.
Start by exporting or filtering your user list and counting genuinely active lines using both filters described earlier. Write the number down. Next, list the lines that expired during the previous month and mark which were extended. That gives you the renewal cohort and its rate in one pass. Then open the credit log, total the credits spent, and split that total between new activations and renewals. Divide your income for the month by the credits consumed.
Finally, look at the eight or ten customers you lost and note how long each one had been with you. This is the part everyone skips and the part that changes behaviour, because non-renewals stop being a percentage and become a short list of specific situations you can recall.
Five figures, one short list. If it takes longer than half an hour you are collecting more than you will act on. A reseller dashboard that exposes usage logs, expiry data and bulk filters cleanly makes this quicker still, which is a practical reason to weigh the reporting and management tools inside a panel when choosing where to run your IPTV reseller business.
Where the Numbers Stop Being Useful
Panel data records what happened, never why. It will show you that a customer did not renew. It will not show you that they moved house, that their household bought a different service, that a relative set them up with something else, or that they were mildly annoyed by a slow reply three weeks earlier and quietly decided then.
There are also structural limits. Connection logs indicate that a line was used, not how satisfied the person using it was. A single line shared across several devices in one household can look identical to a line being used in ways your terms do not permit. Trial conversion is measurable, but a trial that expires without a purchase might mean the service disappointed, or simply that the person was never a serious buyer.
Treat the numbers as the thing that tells you where to ask questions. The answers come from talking to customers, reading your own support history and being honest about what you promised at the point of sale. Analytics narrows the search. It does not close it.
Frequently Asked Questions
Do IPTV reseller panels include analytics as a built-in feature?
Most include credit logs, user lists with connection status, expiry data and usage records. That is the raw material rather than a finished report. Some panels present summary counts, but the derived figures that matter, renewal rate by cohort, churn by tenure and revenue per credit, generally need calculating yourself from exported or filtered data.
How often should a reseller actually review these numbers?
Monthly for the full set, weekly for one thing only: the list of lines expiring in the next seven days. The weekly check is operational and directly affects renewals. The monthly review is analytical and affects decisions about pricing, packages and where your support effort goes.
What counts as a good renewal rate for an IPTV reseller?
There is no credible published benchmark for this market, and any figure quoted as one should be treated with suspicion. Measure against your own previous months instead. A rate that is stable or improving across a quarter is a healthy sign regardless of its absolute value, and a rate declining three months running needs investigating whatever the starting point was.
Should trial conversion be tracked separately from renewals?
Yes, because they measure different failures. Trial conversion tells you whether your offer and setup process work for new prospects. Renewal rate tells you whether the service holds up over time. A business can have strong conversion and weak retention, which usually points at a gap between what was sold and what was delivered.
How do I measure churn if I do not have a CRM?
A spreadsheet is sufficient for several hundred customers. One row per line with creation date, expiry date, subscription length, credits used, amount charged and renewal status. Add a column each month. Everything discussed here can be calculated from those six fields, and the discipline of updating it matters more than the tool.
Turning the Numbers Into Decisions
IPTV Reseller Panel Analytics is not a dashboard feature you switch on, it is a short monthly habit built from data your panel already holds. Count active lines honestly, measure renewals against the cohort that actually expired, segment churn by how long customers stayed, and watch what each credit returns in revenue. Those four figures will tell you whether your growth is real or whether you are refilling a bucket with a hole in it.
Accept that they explain where to look, not what people were thinking. The follow-up conversation with a customer who left, or the support ticket you reread with fresh eyes, is where the actual reason usually turns up. Start this month: pull your expiry list, work out one renewal rate, and write it down somewhere you will see it next month. A single number with a month of history attached is worth more than any report you never open.
[…] dates scatter across the calendar and the mental model breaks. This is usually the point at which a UK IPTV reseller first misses a renewal without […]